Services

Data Blending

It is the merging of different data source formats and data types into one continuous format.
Data Augmentation

Also referred to as “enrichment” it refers to programmatically linking data from multiple sources to create a larger and more comprehensive data source
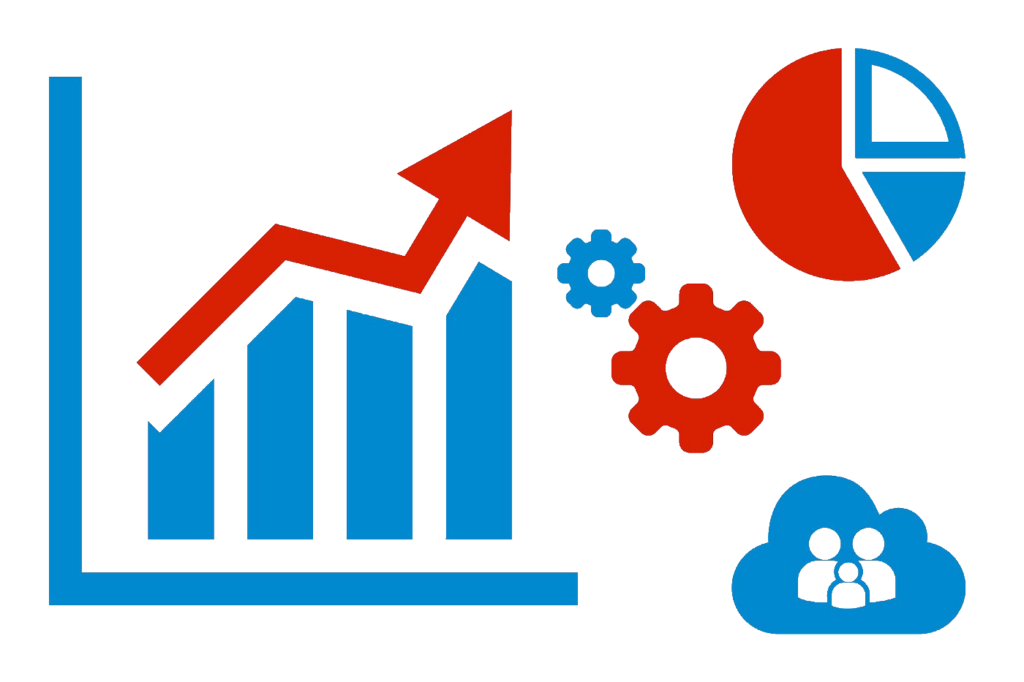
Data Visualisation

Graphical representation of data into visual elements such as charts, graphs and maps. They are used to facilitate the identification of patterns and outliers in data.

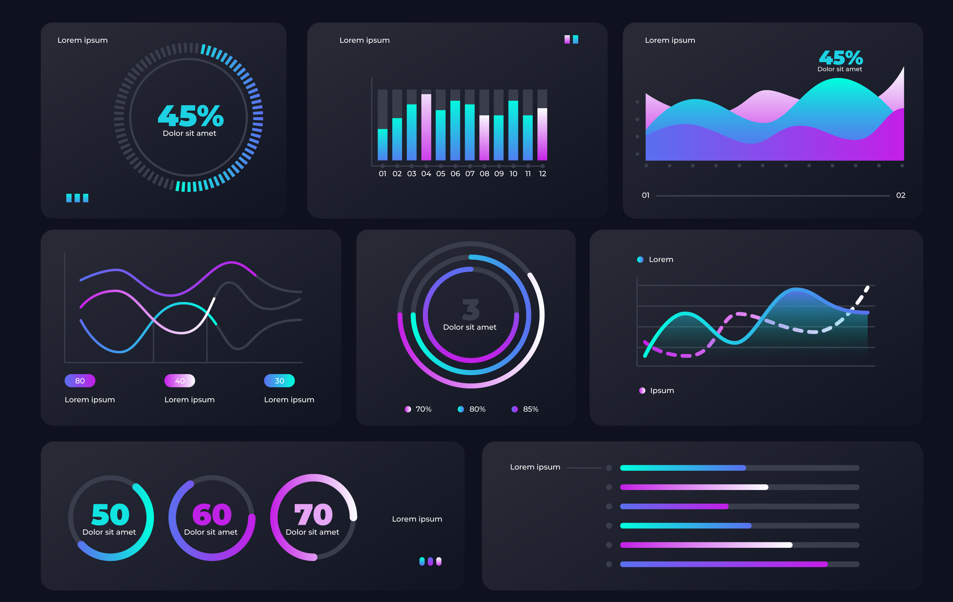
Data Blending

Captation

Automatically retrieve information regardless of the format or tools used. Your multi-sources and multi-format data will no longer be a concern.

Combining

Combining data sources require a special analysis to show accurate results and indicators, while remaining consistent. Create links between your data to leverage them. You need unified data that can be linked to answer specific and precise questions

Expansion of Data

Data Blending allows the expansion of data required to build good quality business intelligence which will further be used to make decisive business decision.

Cleaning

A major issue in data-driven work is the trust we can place in data. Indeed, a data that is not reliable will not allow informed decisions. This is why cleaning and preparing data before their use is essential.

Normalizing

Data heterogeneity is a challenge during digital transformation, automating its processing offers clean, reliable and readable data.

Enriching

Your existing data from your current tools as well as your collaborators knowledge and experience give sense to your data. We can enrich your data to make them even more relevant from management rules that only you know and master.

Data Augmentation

Data Visualisation

Restitution

After retrieving and increasing data, understanding it correctly is essential. An efficient data restitution makes information easily accessible, while allowing you to go deeper. Restitution is the only source of information for informed users.

Visualization

Control/visualization/decision support Dashboards are the instrument of strategy deployment. They are no longer for managers only. More and more actors are required to make decisions, and each need a management chart perfectly adapted to their activity.

Decision support

Increasing the visibility of activities to make better decisions, but also anticipate and see the direct and concrete effects of various decisions.